Kenya Land Prices in 2026: What an Acre Actually Costs, Area by Area
Land prices per acre across Kenya in 2026 — from KES 561M in Upper Hill to KES 19M in Kitengela. HassConsult Q1 data, satellite towns, coast, and rural.
Kenya Land Prices in 2026: What an Acre Actually Costs, Area by Area
Land remains the single most common investment vehicle in Kenya. It is also the most misunderstood. A buyer in Kitengela and a buyer in Upper Hill are both purchasing "land in Nairobi," yet the price gap between them is roughly 30 to 1. An acre in Upper Hill now costs KES 561 million. An acre in Kitengela costs KES 18.8 million. Both figures come from the same HassConsult Land Price Index for Q1 2026 — the most widely cited benchmark for Kenyan land values.
This guide compiles the latest land price data across Kenya — from Nairobi's premium suburbs and satellite towns to the coast, Rift Valley, and rural counties — so you can compare what an acre, a quarter-acre, and a standard 50×100 plot actually costs in the area you are considering. Every price is sourced, every trend is contextualised, and every risk is flagged.
Key Findings: Kenya Land Market Q1 2026
Metric | Value | Trend |
|---|---|---|
Nairobi suburb avg price per acre | KES 228.8 million | +5.2% YoY, +0.8% QoQ |
Satellite town avg price per acre | KES 33 million | +4.3% YoY, +0.5% QoQ (5-year low) |
Most expensive suburb | Upper Hill — KES 561.1M/acre | — |
Least expensive suburb | Karen — KES 77M/acre | +1.3% QoQ |
Most expensive satellite town | Ruaka — KES 112.6M/acre | — |
Strongest satellite growth (YoY) | Ruiru — +10.6% | KES 40.5M/acre |
Sharpest satellite decline (QoQ) | Athi River — -2.5% | KES 20.8M/acre |
Avg quarter-acre (satellite) | KES 8.3 million | Up from KES 5.5M in 2021 |
50×100 plot range (satellite) | KES 500K – 3.5 million | Entry-level depends on town |
Coastal land (per acre) | KES 5M – 20M | Tourism-driven demand |
Rural agricultural land (per acre) | KES 400K – 2M | Stable, location-dependent |
Source: HassConsult Land Price Index Q1 2026, Business Daily, Capital FM, BuyRentKenya. Prices reflect asking/market prices and may vary by specific plot, access, and documentation status.
Macroeconomic Context: What Is Driving the 2026 Land Market
Kenya's land market in 2026 is shaped by three macroeconomic forces pulling in different directions. First, tighter household budgets: inflation, while lower than 2023 peaks, has eroded middle-class purchasing power over two consecutive years. The Central Bank of Kenya's benchmark rate adjustments have rippled through mortgage affordability, though most land transactions in Kenya remain cash-based rather than debt-financed. Second, planning and regulatory uncertainty: Nairobi County's building approval process has become a bottleneck, with the value of new building approvals falling 9.3% in the 12 months to December 2025 according to HassConsult. Developers cannot confidently project what they will be permitted to build on acquired land, which dampens their willingness to buy. Third, a shift toward liquid assets: government securities and unit trusts are attracting capital that would previously have flowed into speculative land purchases, especially at a time when land appreciation rates have slowed.
The net effect is a bifurcated market. Standalone houses in Nairobi's suburbs are appreciating strongly (Lavington +4.2% QoQ, Spring Valley +4.0%, Kilimani +3.9%) because supply is constrained. Apartments, on the other hand, are correcting in oversupplied corridors — Westlands apartment prices fell 2.8% in Q1 2026 alone. Land prices sit somewhere in between: still positive on a yearly basis, but with quarterly momentum clearly fading.
For buyers, this is not a crisis — it is a recalibration. The 2023–2024 frenzy, when satellite town land appreciated 15–21% annually, was unsustainable. A market growing at 4–5% annually is healthier, and for patient buyers, current conditions offer better negotiating power than at any point in the last three years.
Why Land Prices Vary So Much in Kenya
Five factors explain virtually all land price variation in Kenya. Understanding them prevents the single biggest mistake buyers make: comparing an acre in one location to an acre in another without context.
Proximity to economic activity is the dominant driver. Land within Nairobi's commercial core (Upper Hill, Westlands, Kilimani) trades at 20–30 times the price of satellite town land because it can be developed into high-density commercial or residential buildings that generate proportionally higher income per square metre. Infrastructure access — particularly tarmac roads, water, and sewer connections — is the second factor, and the reason satellite towns along the Thika Superhighway (Ruiru, Juja) command higher prices than those with weaker road links. Zoning and development density dictate what can legally be built; an acre zoned for high-rise apartments is worth more than an acre zoned for single-family homes. Title deed status directly affects price — freehold land with a clean title commands a premium over leasehold or community land with conversion requirements. Finally, speculation and sentiment create short-term swings, particularly in satellite towns where infrastructure announcements can trigger rapid appreciation followed by corrections once the growth is "priced in."
Nairobi Suburbs: Land Prices Per Acre (Q1 2026)
Nairobi's 18 tracked suburbs averaged KES 228.8 million per acre in Q1 2026, up 5.2% year-on-year but growing at just 0.8% quarter-on-quarter — down from 1.3% in Q4 2025. According to HassConsult, the slowdown reflects uncertainty around Nairobi County planning approvals and tighter economic conditions reducing developer confidence.
Suburb | Price Per Acre (KES M) | QoQ Change | Notes |
|---|---|---|---|
Upper Hill | 561.1 | — | Most expensive; commercial/mixed-use demand |
Westlands | 501.6 | — | Corporate HQ corridor |
Parklands | 469.7 | — | Residential + hospital cluster |
Kilimani | 437.8 | +1.4% | High-density apartment market |
Kileleshwa | 336.2 | +1.6% | Spillover demand from Kilimani |
Nyari | 125.0 | +3.1% | Strongest QoQ growth in suburbs |
Ridgeways | 92.5 | — | Mixed-use, improving infrastructure |
Lang'ata | 90.9 | +2.4% | Second-strongest QoQ growth |
Karen | 77.0 | +1.3% | Least expensive suburb; large plots |
Five suburbs recorded price contractions in Q1 2026: Muthangari (-2.8%), Loresho (-2.0%), and Kitisuru (-1.5%) led the declines. Source: HassConsult Q1 2026.
For individual buyers, suburban land is largely inaccessible — even Karen's "affordable" KES 77 million per acre translates to roughly KES 19.3 million for a quarter-acre plot. The suburban land market is dominated by developers assembling parcels for apartment and townhouse projects. If you are buying to build a personal home, satellite towns offer significantly more realistic entry points.
Satellite Towns: Land Prices Per Acre (Q1 2026)
Nairobi's 14 tracked satellite towns averaged KES 33 million per acre in Q1 2026 — up just 0.5% in the quarter, the slowest pace of growth in five years. This follows a sharp rally over the past decade that saw the average price per acre double from KES 16 million (2016) to KES 33 million (2026). According to HassConsult, the infrastructure-led appreciation that drove earlier growth has now been largely absorbed into current valuations.
Town | Price Per Acre (KES M) | QoQ Change | YoY Change |
|---|---|---|---|
Ruaka | 112.6 | — | — |
Kiambu | 48.9 | — | — |
Mlolongo | 47.1 | — | — |
Ruiru | 40.5 | +2.8% | +10.6% (strongest) |
Syokimau | 39.5 | -0.7% | — |
Ngong | 35.6 | -1.7% | -2.3% |
Tigoni | 34.8 | -0.9% | — |
Juja | — | — | Single-digit growth (down from 18%+ in 2023) |
Ongata Rongai | 29.4 | +0.9% | — |
Limuru | 27.4 | -0.7% | — |
Athi River | 20.8 | -2.5% | — (sharpest decline) |
Kitengela | 18.8 | +0.8% | — |
Seven of 14 satellite towns posted negative land price movements in Q1 2026. Source: HassConsult Q1 2026.
The most important trend for 2026: the satellite town land boom is over, but prices have not collapsed. Towns like Ngong, which saw 21.4% annual growth in 2023, contracted by 2.3% in the year to March 2026. This is not a crash — it is a normalisation. Buyers who entered at peak prices in 2023–2024 may face flat or slightly negative returns in the short term. Buyers entering now at current prices, particularly in towns with ongoing infrastructure investment (Ruiru, Juja, Kitengela), are buying at a more sustainable baseline.
What a Standard 50×100 Plot Costs in 2026
Most individual Kenyan land buyers purchase 50×100-foot plots (approximately 1/8 acre or 464 square metres), not full acres. A standard acre subdivides into roughly eight 50×100 plots. Here is what that translates to in practice:
Location | Acre Price (KES M) | Est. 50×100 Plot Price (KES) | Quarter-Acre Price (KES M) |
|---|---|---|---|
Kitengela | 18.8 | 2.0M – 2.5M | 4.7 |
Athi River | 20.8 | 2.0M – 3.0M | 5.2 |
Ongata Rongai | 29.4 | 2.5M – 4.0M | 7.4 |
Ngong | 35.6 | 3.0M – 5.0M | 8.9 |
Ruiru | 40.5 | 3.5M – 6.0M | 10.1 |
Ruaka | 112.6 | 10M – 15M | 28.2 |
Note: Developer-subdivided plots often carry premiums of 15–30% over raw land prices because they include surveyed boundaries, access roads, and sometimes water/electricity connections. The ranges above reflect both raw and developer-subdivided pricing. Actual prices depend on specific location within the town, road access, and documentation status.
For first-time buyers on a budget, the most accessible entry points in 2026 are Kitengela (from ~KES 2M for a 50×100), Athi River (from ~KES 2M), and Ongata Rongai (from ~KES 2.5M). Further from Nairobi, towns like Malindi and Nanyuki offer 50×100 plots from KES 150K–450K, though with less infrastructure and slower appreciation.
Beyond Nairobi: Land Prices by Region
Coastal Kenya
Coastal land prices are driven primarily by tourism and expatriate demand. An acre in prime locations like Diani and Nyali can cost KES 15–20 million, while less developed coastal areas (Kilifi outskirts, Malindi hinterland) trade at KES 5–10 million per acre. Beachfront plots command significant premiums. The key risk on the coast is land tenure — much coastal land is leasehold or has complex historical ownership claims. Always verify through the title deed verification process and work with a local lawyer experienced in coastal land transactions.
Rift Valley and Western Kenya
Agricultural land in the Rift Valley (Nakuru, Naivasha, Nanyuki corridor) ranges from KES 1–5 million per acre depending on fertility, water access, and proximity to towns. Naivasha — benefiting from the flower industry and growing tourism — commands prices at the upper end. Nanyuki, positioned as a lifestyle and retirement destination, has seen plot prices climb to KES 400K–1M for 50×100 plots near town.
Rural Kenya
Agricultural and rural land in counties like Bungoma, Kakamega, Bomet, and Migori typically trades at KES 400K–2 million per acre. Fertile farmland with reliable rainfall commands higher prices. The key risk in rural land is unclear succession — inherited land that has not been formally subdivided and registered can lead to lengthy and expensive legal disputes. Refer to our land buying guide for the due diligence steps before any rural purchase.
Land as an Investment: How It Compares (2017–2026)
HassConsult's Q1 2026 report includes a striking comparison of KES 1 million invested at the end of 2017 across different asset classes:
Asset Class | Value in Q1 2026 (KES) | Total Return |
|---|---|---|
Land — Nairobi satellite towns | 13.5 million | +1,250% |
Land — Nairobi suburbs | 7.6 million | +660% |
Government bonds | 4.94 million | +394% |
Developed property | 2.9 million | +190% |
Bank savings | 1.7 million | +70% |
Equities (NSE) | 630,000 | -37% |
Source: HassConsult Q1 2026 via The Star. Returns are nominal (not inflation-adjusted). Past performance does not guarantee future results.
The numbers are remarkable — and they explain why land remains Kenya's preferred investment vehicle. But context matters. The satellite town returns were driven by an extraordinary infrastructure build-out (Thika Superhighway, Mombasa Road, Ngong Road dualling) that has now been largely "priced in." The double-digit annual growth of 2023–2024 has given way to low single digits. Buyers entering the market in 2026 should not expect to replicate the 2017–2026 returns. A realistic expectation for well-located satellite town land is 5–10% annual appreciation, with individual towns varying based on infrastructure progress and demand dynamics.
Risks and Red Flags for Land Buyers in 2026
Risk | Severity | Mitigation |
|---|---|---|
Fake or forged title deeds | High | Verify every title on Ardhisasa before paying any deposit |
Double-sold plots | High | Conduct an official search at the Land Registry; visit the plot physically |
Community/group land without individual title | High | Confirm the land has been formally subdivided and registered as individual freehold |
Buying in road reserve or riparian land | High | Check survey maps and county development plans; engage a licensed surveyor |
Planning approval uncertainty (Nairobi) | Medium | Verify county zoning before assuming what can be built; get pre-approval in writing |
Overpaying during speculation peaks | Medium | Compare with HassConsult index data; do not rely solely on seller's asking price |
Succession disputes on inherited land | Medium | Require grant of probate and full succession documentation before purchase |
Infrastructure promises that never materialise | Medium | Buy based on current access, not promised future roads or amenities |
Land fraud is the single biggest financial risk in Kenyan real estate. An estimated KES 20+ billion is lost to land scams annually in Kenya. Before purchasing any plot, verify the title deed through Kenya's Ardhisasa digital land registry, confirm the seller's identity matches the registered owner, and engage a lawyer to conduct a thorough search. Read our guide to spotting fake title deeds for 15 specific warning signs to watch for.
Guidance for Different Buyer Types
First-Time Land Buyers
Start with what you can verify, not what you can afford. A cheap plot with unclear documentation will cost more in legal fees and stress than a slightly more expensive plot with a clean freehold title. Focus on satellite towns with established road access (Kitengela, Ruiru, Athi River). Budget KES 2–5 million for a 50×100 plot with road access and basic infrastructure. Use our due diligence checklist before signing anything.
Self-Build Buyers
If you are buying to build a family home, factor in the full cost: land + construction + connection fees (water, electricity, sewer) + county approval fees + contingency. A 50×100 plot at KES 3 million plus a modest 3-bedroom bungalow at KES 4–6 million means a total budget of KES 7–9 million minimum. Use our stamp duty calculator to estimate transfer costs.
Investment Buyers
Land investment in 2026 requires more selectivity than in the boom years of 2020–2024. Prioritise towns with ongoing (not just planned) infrastructure development, verifiable title deeds, and strong rental demand if you plan to develop. Ruiru's 10.6% annual growth makes it the standout performer for 2026, driven by Tatu City and continued Thika Superhighway spillover effects.
Diaspora Investors
If you are buying land from the USA, UK, UAE, or elsewhere abroad, the due diligence requirements are identical — but the execution risks are higher because you cannot easily visit the site, attend the land registry in person, or oversee the transfer process. Work only with verified agents who have been background-checked. Appoint a trusted local representative with a power of attorney. And never transfer money before independently verifying the title deed through Ardhisasa. Read our complete diaspora investment guide for the full process.
Master Data Table: Kenya Land Prices at a Glance (Q1 2026)
Region / Area | Price Per Acre (KES) | 50×100 Plot (KES) | YoY Trend | Primary Buyer |
|---|---|---|---|---|
Nairobi suburbs (avg) | 228.8M | N/A (developer land) | +5.2% | Developers |
Upper Hill | 561.1M | N/A | — | Commercial developers |
Westlands | 501.6M | N/A | — | Commercial/mixed-use |
Kilimani | 437.8M | N/A | — | Apartment developers |
Karen | 77M | ~19M (quarter-acre) | +1.3% QoQ | High-end homebuilders |
Satellite towns (avg) | 33M | 2M – 6M | +4.3% | Self-build, developers |
Ruiru | 40.5M | 3.5M – 6M | +10.6% | Middle-class homebuilders |
Kitengela | 18.8M | 2M – 2.5M | +0.8% QoQ | First-time buyers |
Athi River | 20.8M | 2M – 3M | -2.5% QoQ | Budget self-build |
Coast (prime) | 15M – 20M | 2M – 3M | Tourism-driven | Investors, hospitality |
Coast (developing) | 5M – 10M | 500K – 1.5M | Moderate | Long-term investors |
Rift Valley towns | 1M – 5M | 200K – 800K | Moderate | Agricultural, lifestyle |
Rural counties | 400K – 2M | 100K – 300K | Stable | Agricultural |
Sources: HassConsult Q1 2026 (Nairobi suburb/satellite data), BuyRentKenya, Username Properties, developer listings. Coastal and rural ranges are market estimates based on aggregated listing data.
Frequently Asked Questions
How much does an acre of land cost in Nairobi in 2026?
According to the HassConsult Q1 2026 Land Price Index, land in Nairobi's suburbs averages KES 228.8 million per acre. The most expensive suburb is Upper Hill at KES 561.1 million per acre, while Karen is the most affordable suburb at KES 77 million per acre. In satellite towns surrounding Nairobi, the average is KES 33 million per acre, ranging from KES 18.8 million in Kitengela to KES 112.6 million in Ruaka.
How much is a 50×100 plot in Kenya in 2026?
A standard 50×100 plot (1/8 acre or 464 sqm) costs between KES 500,000 in developing areas far from Nairobi to KES 6 million or more in high-demand satellite towns like Ruiru and Syokimau. In Kitengela, expect KES 2–2.5 million; in Ongata Rongai, KES 2.5–4 million; in Ruiru, KES 3.5–6 million. Developer-subdivided plots with infrastructure cost 15–30% more than raw land.
Is land still a good investment in Kenya in 2026?
Historically, land in Nairobi satellite towns has outperformed every other asset class, returning 1,250% over 2017–2026 according to HassConsult. However, the rapid appreciation era is moderating — satellite town growth slowed to 4.3% annually in Q1 2026, down from 9.93% the previous year. Land remains a solid long-term hold, but buyers should expect 5–10% annual returns rather than the 15–20% growth seen in 2023. Selectivity matters more now than ever.
Which satellite town has the fastest-growing land prices?
Ruiru leads all tracked satellite towns with 10.6% year-on-year growth and 2.8% quarter-on-quarter growth as of Q1 2026. This is driven by proximity to the Thika Superhighway, Tatu City development, and strong residential demand. In contrast, former growth leaders like Ngong (-2.3% YoY) and Athi River (-2.5% QoQ) are now in correction territory.
How do I verify that a piece of land in Kenya is genuine before buying?
Use Kenya's Ardhisasa digital land registry system to conduct an online search of the title deed number. This will confirm the registered owner, land size, and any encumbrances (loans or caveats). You should also conduct a physical site visit to confirm boundaries match the survey plan, engage a licensed surveyor, and hire a lawyer to do a full Land Registry search. Never pay a deposit before completing these steps. Read our title deed verification guide for the complete process.
Why are land prices falling in some satellite towns?
Seven of Nairobi's 14 tracked satellite towns posted negative land price movements in Q1 2026. HassConsult attributes this to three factors: infrastructure-driven appreciation has been "priced in" after years of rapid growth; tighter economic conditions have reduced purchasing power among middle-class self-build buyers; and investor capital is shifting toward more liquid assets like government securities and unit trusts. This is a market normalisation, not a crash — average satellite town prices are still 50% above their 2021 levels.
Explore Further
Ready to start your land search? Browse verified listings from background-checked agents across Kenya's most active land markets.
Land guides:
Browse listings:
All prices in this guide reflect market data as of Q1 2026 (January–March). Land prices fluctuate based on location, access, documentation, and market conditions. Always conduct independent due diligence before purchasing land in Kenya. Afriqahome is a marketplace that connects buyers with verified agents — we do not buy, sell, or own property.
Other Guides
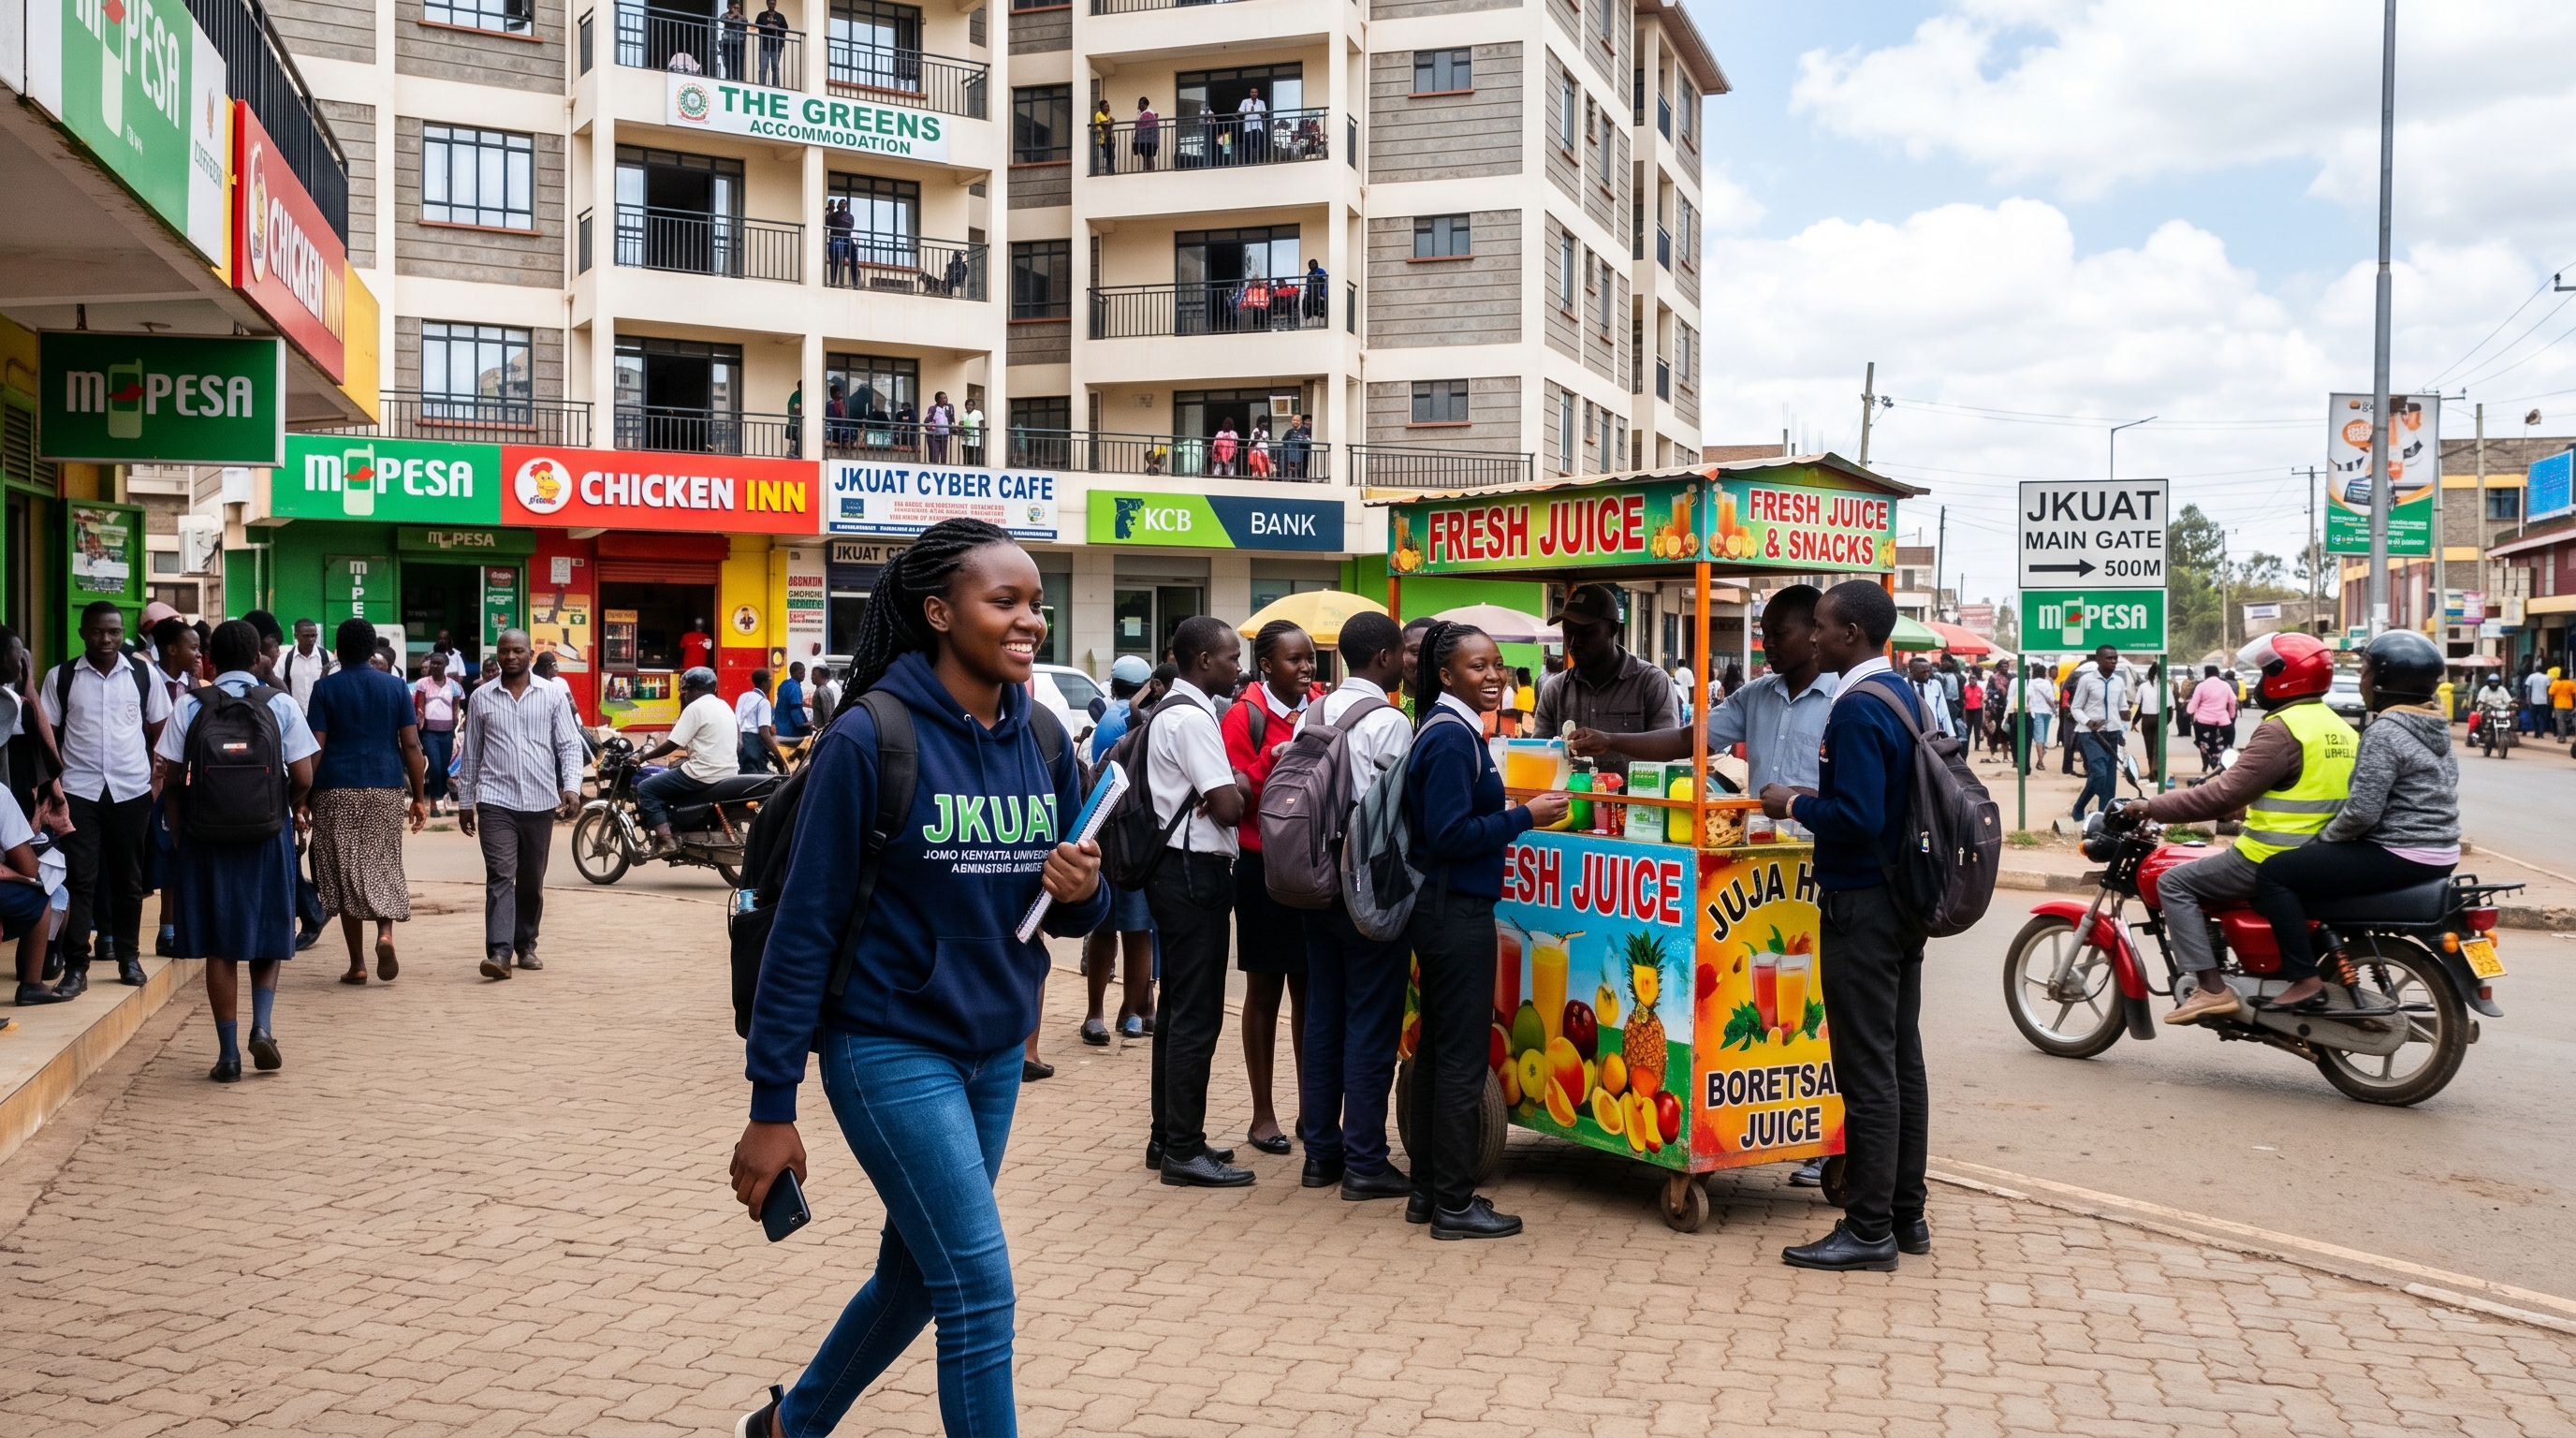
Living in Juja, Kiambu: The University Town That Became a Satellite City — Prices, Estates & Honest Guide (2026)
Juja houses from KSh 1.2M, rent from KSh 2.5K. JKUAT area, Kenyatta Road estates, Kalimoni, Witeithie. Student yields 9-15%.
Westlands Property Guide: Prices, Lifestyle & Investment (2026)
Complete guide to Westlands real estate. Apartments from KES 8M, rental yields 6-8%, plus lifestyle amenities. Browse verified Westlands listings today.
Houses for Sale in Karen: Price Guide 2026
Karen house prices from KES 35M–250M+. 4-bedroom, 5-bedroom, villas. Karen Hardy, Ndege Road, budget breakdown. Updated March 2026.